
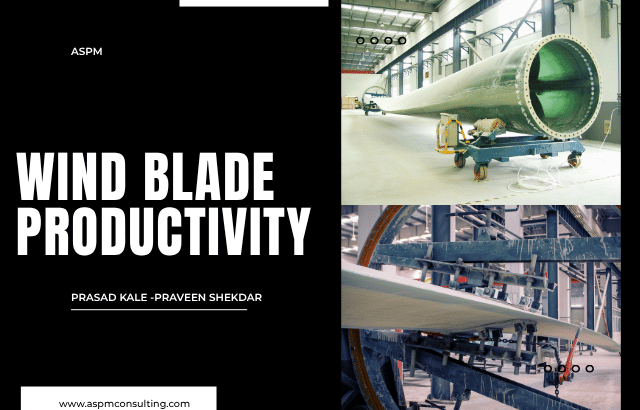
By Praveen Shekdar | Prasad Kale ASPM Consulting
When a Small Problem Becomes a Factory-Wide Productivity Loss
A wind turbine blade factory can appear highly organised: large moulds, skilled technicians, composite materials, vacuum systems, cranes and sophisticated inspection processes. But consider what happens when a vacuum leak is discovered during infusion. The infusion stops. Operators wait. The curing schedule moves. The mould remains occupied. Inspection gets rescheduled. Material and labour plans change. A problem involving one process can affect several downstream operations. This is the reality of blade manufacturing. Productivity is not determined by how fast one operation is performed. It is determined by how effectively the entire manufacturing system works together. With turbines becoming larger and global wind deployment expanding, blade manufacturers face increasing pressure to improve throughput while controlling labour, material, energy, quality and delivery costs. The Global Wind Energy Council reported approximately 178 GW of wind capacity mechanically installed globally in 2025. The average turbine installed globally also continued to increase in size, reaching approximately 6.16 MW for onshore turbines and 10.31 MW for offshore turbines. For manufacturers, bigger turbines mean bigger manufacturing challenges.
The Productivity Challenge in Wind Turbine Blade Manufacturing
Blade manufacturing combines large-scale composite production with significant manual work, complex material handling, long process cycles and demanding quality requirements. The major productivity challenge is therefore not simply labour efficiency. It is the ability to synchronise:
- People
- Moulds
- Materials
- Equipment
- Engineering
- Quality
- Maintenance
- Energy
- Inspection
- Supply chain
When one element is out of sequence, capacity is lost.
Key Challenges Faced by Wind Turbine Blade Manufacturers
1. Long and Variable Production Cycle Times
Blade manufacturing contains many interdependent activities. Layup, infusion, curing, finishing, bonding and inspection can create bottlenecks when not properly synchronised. A factory may have sufficient labour but still miss its production target because moulds, materials, inspection or equipment are not available at the right time.
Productivity Improvement
Measure the complete cycle rather than individual operations.
- Production time
- Waiting time
- Changeover time
- Inspection time
- Repair time
- Material waiting time
The objective should be to reduce total lead time, not simply increase operator speed.
2. Mould Utilisation and Capacity Constraints
Moulds are among the most important assets in a blade factory. A mould may be unavailable because of production, preparation, cleaning, repair, curing, inspection or waiting. Consequently, the number of moulds does not necessarily represent the factory’s true production capacity.
Productivity Improvement
Track:
- Mould availability
- Mould utilisation
- Changeover time
- Mould downtime
- Production output per mould
Improving mould utilisation can release additional capacity without adding another mould.
3. Rework and Defects
Rework is one of the most expensive productivity losses in composite manufacturing. A defect identified during layup may be relatively easy to correct. The same defect discovered after infusion, curing or bonding can consume significantly more labour and production capacity. A 2026 blade-manufacturing process-improvement study reported substantial repair and waiting losses and demonstrated significant reductions in repair time through improvement actions.
Productivity Improvement
Move quality control upstream.
- First-time-right production
- Standard work
- Process verification
- Early defect detection
- Root-cause analysis
- Digital traceability
Quality improvement is productivity improvement because every avoided repair releases capacity.
4. Labour Productivity and Skill Dependency
Blade manufacturing requires skilled operators, but productivity can suffer when only a small number of employees can perform critical operations. This creates both a productivity problem and an operational risk.
Productivity Improvement
Develop a skill matrix covering critical operations and progressively increase the percentage of multi-skilled employees. Track:
- Labour hours per blade
- Value-added labour hours
- Waiting hours
- Rework hours
- Skill coverage
- Training hours
The objective is not simply fewer labour hours. The objective is more productive hours and less time lost to waiting, searching and rework.
5. Material Waste and Composite Cost
Fibre, resin, core materials and adhesives represent significant manufacturing inputs. Scrap therefore represents more than material cost. It also represents lost labour, energy, processing time and production capacity. Vestas reported approximately 54 kt of waste in 2025, with approximately 69% recycled, and identified blade manufacturing as its largest internal waste category.
Productivity Improvement
Track material productivity at blade level:
- Fibre scrap kg per blade
- Resin consumption per blade
- Core scrap
- Adhesive waste
- Consumables per blade
- Material yield percentage
Reducing scrap is equivalent to recovering production capacity that has already been paid for.
6. Equipment Downtime
A vacuum pump, resin system, heating system, crane or finishing tool may appear to be a small part of the overall factory. But failure of a critical piece of equipment can stop an entire production sequence.
Productivity Improvement
Use preventive and predictive maintenance for critical equipment. Measure:
- MTBF
- MTTR
- Unplanned downtime
- Repeat failures
- Critical spare availability
- Maintenance-related defects
Maintenance productivity means preventing predictable downtime before it becomes production downtime.
7. Energy Consumption
Curing, HVAC, vacuum systems, compressed air, grinding and finishing can contribute significantly to factory energy consumption. Energy should therefore be measured as a production KPI rather than treated only as a utility expense.
Productivity Improvement
Track: kWh per conforming blade and where appropriate: kWh per tonne of conforming product. The objective is not necessarily to reduce total energy consumption. It is to reduce energy required to produce each good blade.
8. Engineering Changes and Production Disruption
Blade design changes can affect material kits, tooling, work instructions, inspection requirements, training and production schedules. Frequent or poorly controlled changes can create hidden productivity losses.
Productivity Improvement
Track engineering-change hours per blade and establish disciplined change-management processes. Every significant engineering change should consider:
- Production impact
- Quality impact
- Material impact
- Training impact
- Inventory impact
- Schedule impact
The Hidden Productivity Loss: Waiting
One of the most underestimated losses in blade manufacturing is waiting. Operators may wait for:
- Materials
- Tools
- Cranes
- Inspection
- Engineering decisions
- Equipment repair
- Work-area availability
Five operators waiting for 60 minutes represents five labour-hours lost. But the real loss can be greater because the delay may also affect the mould, schedule and downstream operations. Every blade factory should therefore measure waiting hours per blade.
Digital Traceability Can Turn Productivity Data Into Action
Modern blade factories can capture information about:
- Material batches
- Operators
- Vacuum pressure
- Temperature
- Humidity
- Infusion time
- Cure profile
- Inspection results
- Repairs
- Equipment
The real value comes when this information is connected. If multiple blades experience the same defect, management can investigate whether the common factor was the material batch, mould, equipment, shift, supplier or process condition. Digital traceability can therefore reduce both quality investigation time and recurring productivity losses.
Automation Should Follow Process Stabilisation
Robotics and automation have significant potential in blade trimming, grinding, finishing and inspection. However: Do not automate an unstable process. The recommended sequence is:
- Stabilise the process.
- Standardise the work.
- Measure variation.
- Remove unnecessary steps.
- Define quality requirements.
- Then evaluate automation.
A 2025 study on wind blade production reported approximately a 28.6% reduction in cycle time and an increase in labour utilisation from 68% to 87% through lean scheduling and SMED-related improvements. This demonstrates that productivity improvement does not always require major capital investment. Better planning and sequencing can release capacity from the existing factory.
Two Short Productivity Case Studies
Case Study 1: Cycle-Time Reduction
A blade manufacturing facility faced long production cycles and poor utilisation of skilled labour. The improvement approach focused on operational-time analysis, SMED principles, parallel activities and resource-constrained scheduling. The published study reported approximately:
- 28.6% cycle-time reduction
- Labour utilisation improvement from 68% to 87%
Lesson: Before investing in new capacity, examine whether existing capacity is being lost through poor sequencing and preparation.
Case Study 2: Material Productivity
Vestas reported approximately 54 kt of waste generated in 2025 and 69% recycled. The company also reported approximately 94% rotor recyclability. Lesson: Material productivity and circularity are increasingly connected to manufacturing competitiveness. Reducing material waste can improve cost, resource efficiency and environmental performance simultaneously.
A Practical Total Productivity Management Dashboard
Production
- Blades produced
- Good blades released
- Cycle time
- Schedule adherence
Quality
- First-pass yield
- Defects per blade
- Rework hours
- Repair cost
Labour
- Labour hours per blade
- Value-added hours
- Waiting hours
- Skill coverage
Moulds and Equipment
- Mould utilisation
- Mould downtime
- Equipment downtime
- MTBF
- MTTR
Materials
- Material yield
- Fibre scrap
- Resin consumption
- Consumables per blade
Energy
- kWh per blade
- kWh per tonne
- Idle energy
Business Performance
- Manufacturing cost per blade
- Capacity utilisation
- On-time delivery
- Working-capital impact
- Operational risk
Views from Praveen Shekdar

Praveen Shekdar Director | ASPM Consulting | Business Transformation & Risk Advisory Leader Wind turbine blade manufacturing should not be viewed only as a production-efficiency challenge. It is a business transformation challenge involving operations, quality, supply chain, cost, technology, people, sustainability and risk.
Productivity Must Create Business Value
Improving one operational metric does not automatically improve business performance. Reducing labour hours, for example, may have little value if it increases rework or delays delivery. Productivity improvement should therefore be connected to:
- Cost per conforming blade
- On-time delivery
- Quality
- Capacity utilisation
- Material efficiency
- Energy efficiency
- Supply-chain resilience
- Operational risk
Productivity and Risk Must Be Managed Together
A productivity improvement can create a new risk if implemented without understanding the complete process. For example, reducing inventory may increase material-shortage risk. Increasing equipment utilisation without improving maintenance may increase breakdown risk. Reducing process time without validating quality may increase defect risk. Therefore, every major improvement should ask two questions: How will this improve productivity? What new risk could this improvement create?
Transformation Requires Cross-Functional Ownership
Productivity cannot remain the responsibility of production alone. Operations, quality, engineering, maintenance, procurement, supply chain, finance, HR, IT and risk management must work toward common performance objectives. The objective is to move from isolated improvement projects to an integrated operating model.
From Operational Excellence to Business Resilience
A highly productive factory can still be vulnerable if it depends on one supplier, one critical machine, one specialised skill or one engineering resource. Productivity management should therefore also identify:
- Single-point failures
- Critical supplier dependencies
- Critical skills
- Equipment dependencies
- Spare-parts risks
- Engineering bottlenecks
- Logistics disruption
- Digital-system dependencies
The goal is not simply a faster factory. It is a productive, resilient and sustainable manufacturing business.
The 10-Step Productivity Improvement Roadmap
Step 1: Establish the Baseline
Measure cycle time, labour hours, waiting, rework, scrap, energy, downtime and output.
Step 2: Map the Complete Value Stream
Map material movement, production, inspection, repair and waiting from incoming material to dispatch.
Step 3: Identify the Five Largest Losses
Use production data to identify where the factory is losing capacity.
Step 4: Standardise Work
Define the best-known method for critical operations.
Step 5: Build Workforce Flexibility
Develop multi-skilled operators and reduce dependence on individual experts.
Step 6: Attack Rework
Use Pareto analysis and root-cause analysis to eliminate recurring defects.
Step 7: Improve Scheduling
Synchronise labour, moulds, materials, inspection, maintenance and engineering support.
Step 8: Strengthen Traceability
Connect process data, material batches, equipment and quality results.
Step 9: Measure Energy and Material Productivity
Add kWh per conforming blade and material scrap per blade to the management dashboard.
Step 10: Establish Daily Management
Every shift should know the previous result, today’s target, major abnormality, responsible owner and corrective action.
What Wind Blade Manufacturers Should Measure Every Day
A simple daily productivity review can focus on ten questions:
- How many good blades were released?
- What was the actual cycle time?
- How many hours were lost waiting?
- How many hours were lost to rework?
- How much mould capacity was available?
- What equipment downtime occurred?
- How much material was scrapped?
- How much energy was consumed per good blade?
- What delivery risk exists?
- What is the single largest productivity loss to eliminate next?
Final Takeaway
The biggest opportunity in wind turbine blade manufacturing is not necessarily to work harder or simply add more capacity. It is to remove the losses that prevent existing capacity from becoming good output. The critical challenges are clear:
- Long cycle times
- Mould constraints
- Rework and defects
- Labour and skill dependency
- Material waste
- Equipment downtime
- Energy consumption
- Engineering changes
- Waiting
- Supply-chain and operational risks
Each of these challenges represents a productivity opportunity. Total Productivity Management brings these opportunities together into one integrated management system. The key question for a wind blade manufacturer is therefore not simply: “How many blades can we produce?” It is: “How many conforming blades can we produce on time, safely, with minimum labour, material, energy, waiting, rework and risk?” That is the foundation of sustainable productivity improvement in wind turbine blade manufacturing.
About the Authors
Prasad Kale is an Industrial Operations & Energy Management Expert with 37 years of experience and associated with ASPM Consulting. His focus includes productivity improvement, manufacturing performance, industrial operations and energy management.
Sources for Industry Statistics
- Global Wind Energy Council, Global Wind Report 2026 and 2025 wind turbine supply-side data.
- International Energy Agency, Energy Technology Perspectives 2026.
- U.S. Department of Energy, Wind Manufacturing and Supply Chain information.
- Processes journal, 2025 research on SMED and resource-constrained scheduling in wind blade production.
- Springer, 2026 research on process improvement in wind turbine blade manufacturing.
- Vestas Annual Report 2025.
- National Renewable Energy Laboratory and National Laboratory of the Rockies research on advanced robotics and wind blade manufacturing.
Disclaimer
The information presented in this article is intended for general informational and educational purposes only. The examples, productivity approaches, observations and case studies are provided to illustrate potential applications in wind turbine blade manufacturing and should not be considered specific operational, engineering, financial, legal or professional advice.
Industry statistics and research findings have been referenced from publicly available sources and may change as new data becomes available. Reported figures and case-study results reflect the methodologies, assumptions and operating conditions of their respective sources and should not be interpreted as guaranteed results for any particular organisation.
Manufacturing performance depends on factors including plant configuration, blade design, equipment, workforce capability, materials, process maturity, quality requirements, energy systems and supply-chain conditions. Any productivity improvement initiative should therefore be evaluated against the organisation’s own operational data, risks and business objectives.
The views attributed to the contributors are presented for professional and informational discussion. Readers should independently validate information before applying any recommendations or making business decisions.
ASPM Consulting and the authors do not accept responsibility for decisions, losses or outcomes resulting from reliance solely on the information contained in this article.